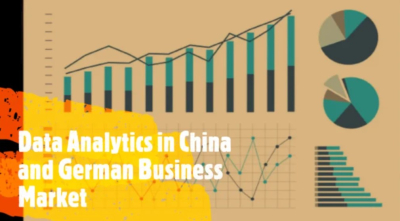


I will create correlation plot for your data

About This Gig
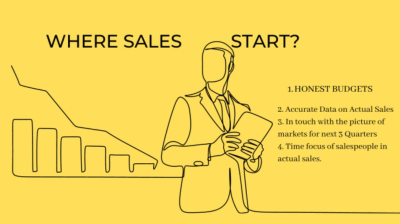
Who is this for?
- Investors
- Trend-analyzers
- Storytellers/Presenters
What type of Data you can have?
- Excel / Spreadsheet / Google Sheet
- Stock Data - or python scraping
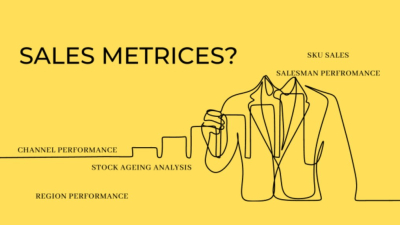
What type of Results can be expected?
- Relationships between Data
- Cause-Effect Relationship
- Understanding if being, Fooled by Randomness
Why me?
- 5+ years of Financial Planning and Analysis (Budgeting, Forecasting, Variance)
- Experience from Deloitte, Honeywell, and Genpact
- 70+ end-to-end projects.
- Masters from the University of Nottingham (United Kingdom)
- CFA L2 cleared (USA)
- FRM P1 cleared (USA)
- Microsoft Certified: Data Analyst (India)
About The Seller

All My Skill
From
Member since
November 2022
Avg. response time
27 minutes
Last delivery
1 year ago
Language
FAQ
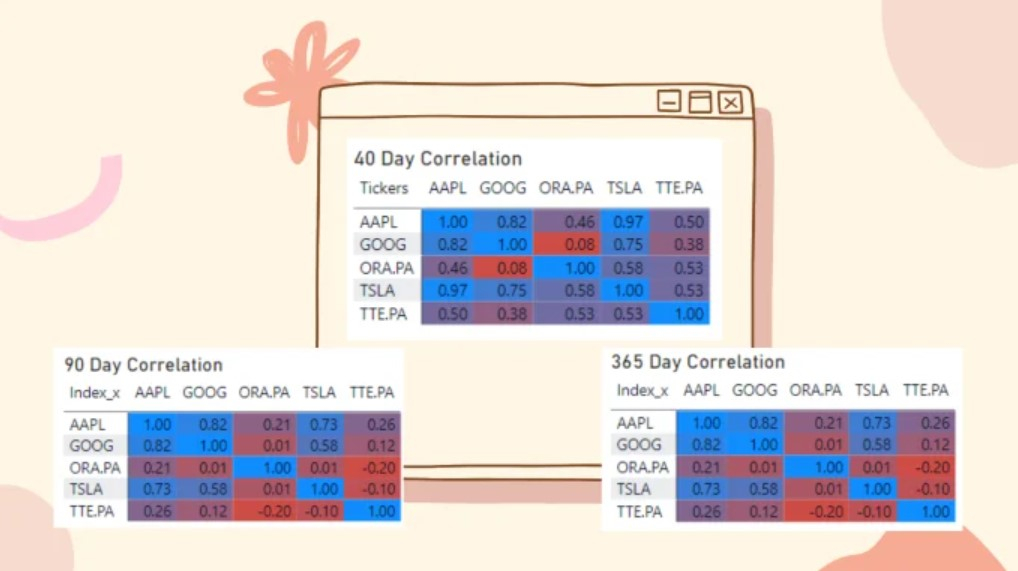
Why is a Corrlelation matrix important?
It shows the connection of your data with other data. And how are they moving in relation to each other.
How can we track the movement of relationships?
We can make short, mid, and long-term plots and track their movements. There will always be movements. We need to check if their relationship is significant and has their relationship changed.
Reviews
5
 0
0
4
0
3
0
2
0
1
0

You may also like the following gigs